

Have you ever wondered how successful investors achieve consistent, impressive returns? If so, The answer lies in grasping CAGR, a key metric offering an accurate representation of investment performance over time.
In the dynamic world of finance, investors are always on the lookout for effective tools to gauge the success of their investments.
However, Excel does not have any direct formula to calculate it. You can use other Excel functions to calculate CAGR; Ratherthan you can use the CAGR calculator tool; it is easy to use and provides the most accurate results.
CAGR, an influential metric, has gained prominence for its ability to indicate a consistent rate of return over a specific period, reflecting geometric progression in investments.
In this article, we will delve into the intricacies of CAGR and explore how utilizing Excel tips can streamline the process, empowering investors to make informed decisions.
What is CAGR?
CAGR, or Compound Annual Growth Rate, is a robust metric that evaluates annual investment growth, considering the compounding effects that influence the overall performance.
Unlike simple rates, CAGR offers a standardized measure, smoothing the volatility in returns. It precisely captures the geometric progression in investments, providing a reliable indicator of average yearly growth over a specified period.
More than a mere average, CAGR serves as a nuanced, smoothed annual rate, offering a precise representation of an investment's growth trajectory.
The formula for calculating CAGR is:
CAGR = (RV / IV) 1 / n – 1
What is the Significance of Accurate CAGR Calculations:
Accurate CAGR calculations are vital for evaluating investment performance. They unveil the historical growth rate, providing crucial insights into an investment's consistency and stability.
Equipped with this understanding, investors can confidently and precisely navigate the ever-changing financial terrain, making well-informed decisions to enhance their financial strategies.
CAGR serves as a reliable metric, offering a standardized measure that transcends the volatility often associated with annualized returns.
How to Unlock Investment Potential: Excel Tips for Accurate CAGR Calculations
Now, let's explore the steps involved in mastering CAGR calculations using Excel.
- Data Organization:
Begin by organizing your investment data in Excel. Create columns for the time period, initial investment value, and final investment value. This structured layout is fundamental to performing accurate calculations. - Applying the CAGR Formula:
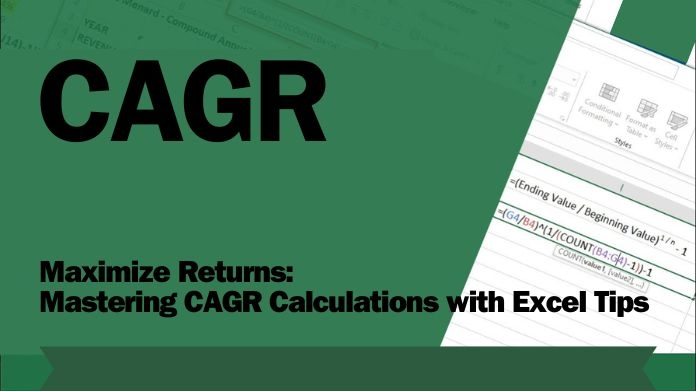
In Excel, the CAGR formula involves the use of the RATE function. The formula is as follows:
CAGR = (Ending Value / Beginning Value) ^ (1/n) - 1
Here, n represents the number of periods. Utilize this formula in a designated cell to compute the CAGR for your Investment automatically. - Consistent Time Periods:
Ensure that your time periods are consistent. Whether you're analyzing monthly, quarterly, or yearly data, maintaining uniformity is crucial for precise CAGR calculations. - Utilizing Excel's Built-in Functions:
Excel offers various built-in functions that streamline the CAGR calculation process. Leverage the POWER function for exponentiation and the LN function for natural logarithms. These functions enhance accuracy and efficiency. - Data Validation:
Implement data validation to avoid errors. Excel's data validation feature allows you to set specific criteria for the input, reducing the risk of inaccuracies in your calculations. - Sensitivity Analysis:
Conduct sensitivity analysis by altering the input values to understand how changes impact the CAGR. Excel's scenario manager can assist in assessing the potential impact of various scenarios on your Investment. - Visualization with Charts:
Enhance your analysis by creating visual representations of your investment data. Excel's charting capabilities enable you to graphically depict the growth trends, making it easier to comprehend and communicate your findings. - Historical Data Trends:
Incorporate historical data trends into your analysis. Excel's sorting and filtering features can help you identify patterns and outliers that may influence the CAGR calculation. - Incorporating External Data:
Excel allows you to import external data sources, such as stock prices or economic indicators, into your spreadsheet. This integration enhances the depth of your analysis and provides a more comprehensive view of the factors influencing your Investment.
What are the Key Considerations of CAGR in Excel:
- Handling Negative Returns:
In the event of negative returns, the CAGR formula may result in complex numbers. To address this, use the ABS function to ensure that the absolute value is used: ABS((B1/A1)^(1/C1)-1)
2. Periodic Contributions:
If your Investment involves periodic contributions or withdrawals, a more advanced CAGR formula is required. Utilize Excel's XIRR function, which accounts for irregular cash flows over time.
3. Graphical Representation:
Enhance your financial analysis by creating a visual representation of your investment growth. Use Excel's charting tools to plot the Investment's value over time, providing a clear visualization of its performance.
Climax
Unlock financial potential by mastering CAGR in Excel. Understand investment intricacies and leverage Excel's power for deeper insights, thorough analyses, and informed decisions.
Accurate calculations and advanced tips simplify navigating complex markets, fostering confidence and contributing to financial success.