

A Complete Guide On MSBI Cheat Sheet

Introduction:
If you are looking for a data management tool that can be used to integrate the data, analyze and construct the reports based on certain Business Requirements. Then BI tools such as MSBI (Microsoft Business Intelligence) can be taken into consideration. This cheat sheet provides the basic concepts which you need to know about the MSBI tool in order to implement it. This cheat sheet can be used as a handy reference sheet for the beginners and the one who already have an idea about the BI tools to get started with it.
To gain in-depth knowledge with practical experience, then explore MSBI Online course
Business Intelligence (BI): BI refers to Business Intelligence. It is a technology-driven term that refers to as a software application used by the organizations to integrate, analyze and present raw data to help the organizations make more informed business decisions and strategic planning. It implements Data Warehousing to give the analysis and decision-making results using some set of tools
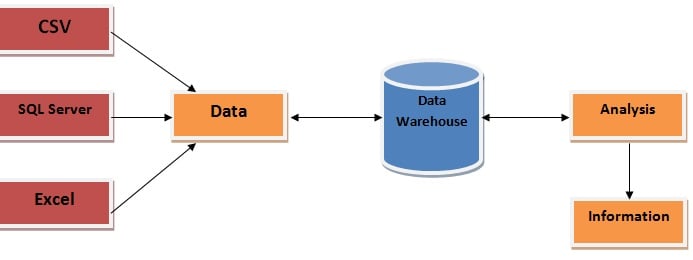
Data Warehousing: It is a tool which divides the analytical workload from the transactional workload and enables an organization to combine data from a number of sources
Database engine: It is a part of SQL Server which creates and drives relational databases
Data integration: In works by combining data from several sources which are stored using various technologies and provide meaningful and valuable information
MSBI: Microsoft + Business Intelligence together is known as MSBI. It is a part of SQL Server which uses a part of SharePoint services. It consists of a set of tools which help in providing the best solution for BI.
MSBI Tools: The tools which are used to transform the Business data into the information. MSBI is categorized into 3 parts based on SQL Server data tool
- SSIS: It is an integration tool referred to as SQL Server Integration Services
- SSAS: It is an analytical tool referred to as SQL Server Analytical Services
- SSRS: It is a reporting tool/ Data view tool referred to as SQL Server Reporting Services
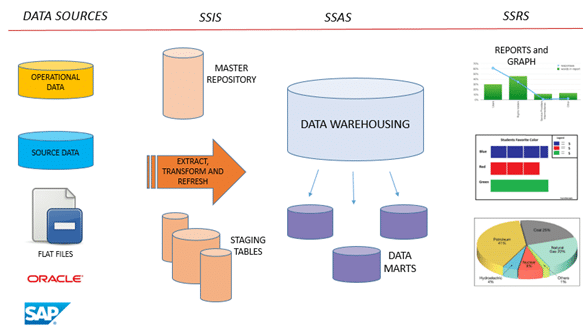
SSIS: SQL Server Integration Services is used for collecting data/information in different formats from various locations and gathering it in a centralized location. The important tasks performed by SSIS is Extraction, Transformation, and Loading. Basically, it is a tool for Data Integration, Data Transformation, and Data Migration
SSAS: SQL Server Analytical Services is used to analyze the centralized stored data. SSAS uses OLAP (Online Analytical Processing) component of MS SQL server and data mining capabilities
SSRS: SQL Server Reporting Service is a graphical generating software system from Microsoft. It is used to present the data graphically which is necessary for an organization to make an effective decision. The SSRS tools develop, design, test and generate reports.
Features of MSBI:
- Provides a single version required to make effective decisions
- Eliminates or reduces the instinctive decisions made
- Provides a quick and timely response to the business-related queries by making it more responsive
- Minimizes the error-prone manual work
- Provides robust support for analysis
- Provides support for historical data
- Supports summarized data
frequently asked MSBI interviewquestions and answers
Components of Microsoft SharePoint:
Shows the function of Microsoft SharePoint parts
- SharePoint Foundation: It is a foundational program used for communication, collaboration and content management.
- SharePoint server: It is a full-featured software product that provides industrial-grade communication, collaboration, and content management
- Infopath Form Services: It is a feature of SharePoint Server which allows InfoPath forms to be embedded in SharePoint Websites
- Excel services: This feature embeds excel documents in a SharePoint website where it can be viewed
- SSRS Integration: It installs an SSRS Server in such a way that it closely works with the SharePoint environment
- Key Performance Indicator(KPI): It is a feature that provides a quick visualization of business information in the organization which provides an indication of how well it is doing
- Business Connectivity Services(BCS): It is a feature of SharePoint that connects to Line of Business (LOB) systems and displays the data that they contain in the SharePoint environment
- Sites: It is a website that SharePoint manages in ways that are compatible with its content-management features
- Document Libraries: It is a mechanism to store content in SharePoint. A document library provides management of the content like document check-in and check-out, workflow, etc.
- Lists: A SharePoint website that contains the lists of data stored in the form of rows and columns
- Wikis: These are the specialized websites that allow the members to update the content
- Blogs: It is a weblog which provides a forum for people to write communications that can be viewed across the organization
- Discussion Boards: It is an intranet location designated for online discussion which is accessible throughout the organization
- Performance Point: It is designed to build advanced reports, scorecards, and dashboards
- Dashboard designer: It is an end-user tool designed to build PerformancePoint content
- Report builder: It is an end-user tool designed to build SQL Server Reporting Services (SSRS) reports
- Scorecard: It is a collection of data which includes graphs, charts, numbers, and other visualization information designed to indicate the progress towards a stated goal
- Dashboard: It is much like a Scorecard which shows the status of key information but is not necessarily involved in the overall goal.